Usage dashboard
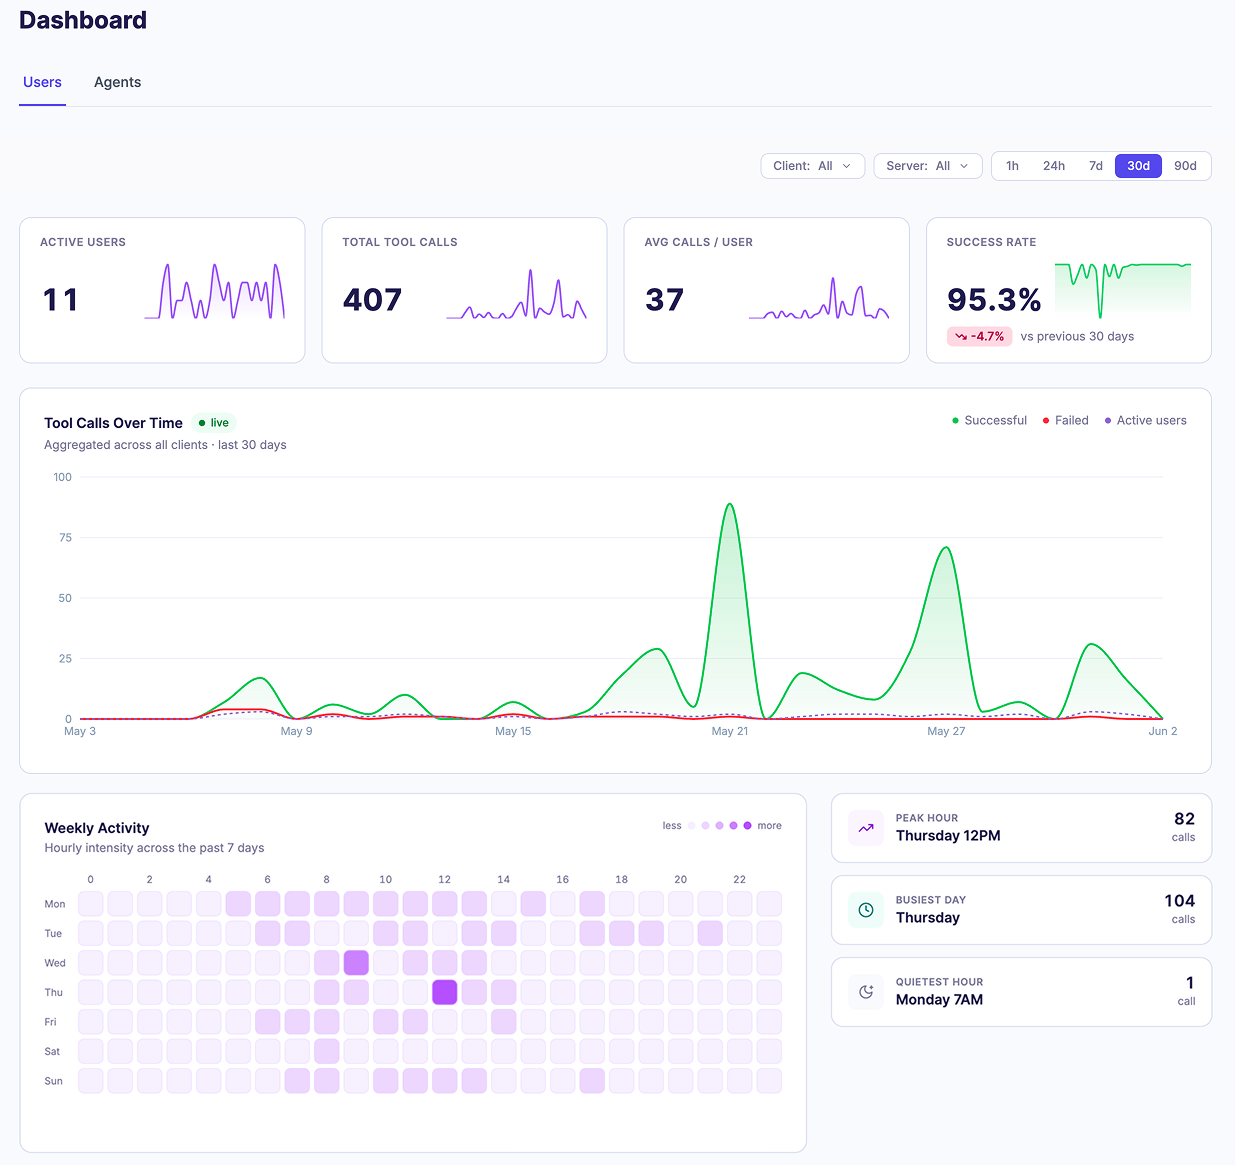
The Usage Dashboard in MCPX Enterprise shows MCP tool activity across your organization. See which users and agents are active, how often they call tools, and how often those calls fail. The dashboard reads from the same tool-usage data MCPX records for every agent interaction.
Security and IT teams use the Usage Dashboard to monitor MCP traffic across the organization, audit which agents and users are calling which tools, and spot reliability problems before they spread. R&D and AI enablement leadership use the same data to track adoption and see where MCP is actually getting used.
What you can monitor
- Agent activity, including which agents are connected and how often they call tools
- User activity, including which users are working through MCPX and which tools they use
- Tool reliability, with success and failure patterns per tool and per server
- Tool adoption, ranking which MCP servers are used most
- Historical trends with period-over-period comparison
💡 MCPX Enterprise Feature - Usage Dashboard is exclusively available on our Enterprise plan.
Contact our team to book a demo and unlock this feature.